Measured vs what the label may show
Pick a nutrient, then slide or click the chart
Federal labeling rule for Nutrition Facts (21 CFR 101.9). Sugar counts about 4 kcal per gram.

For plant, quality and operations leaders
We turn production, quality and lab data into a few clear charts and a plain note on what changed, why it matters and what to check next.
In our product
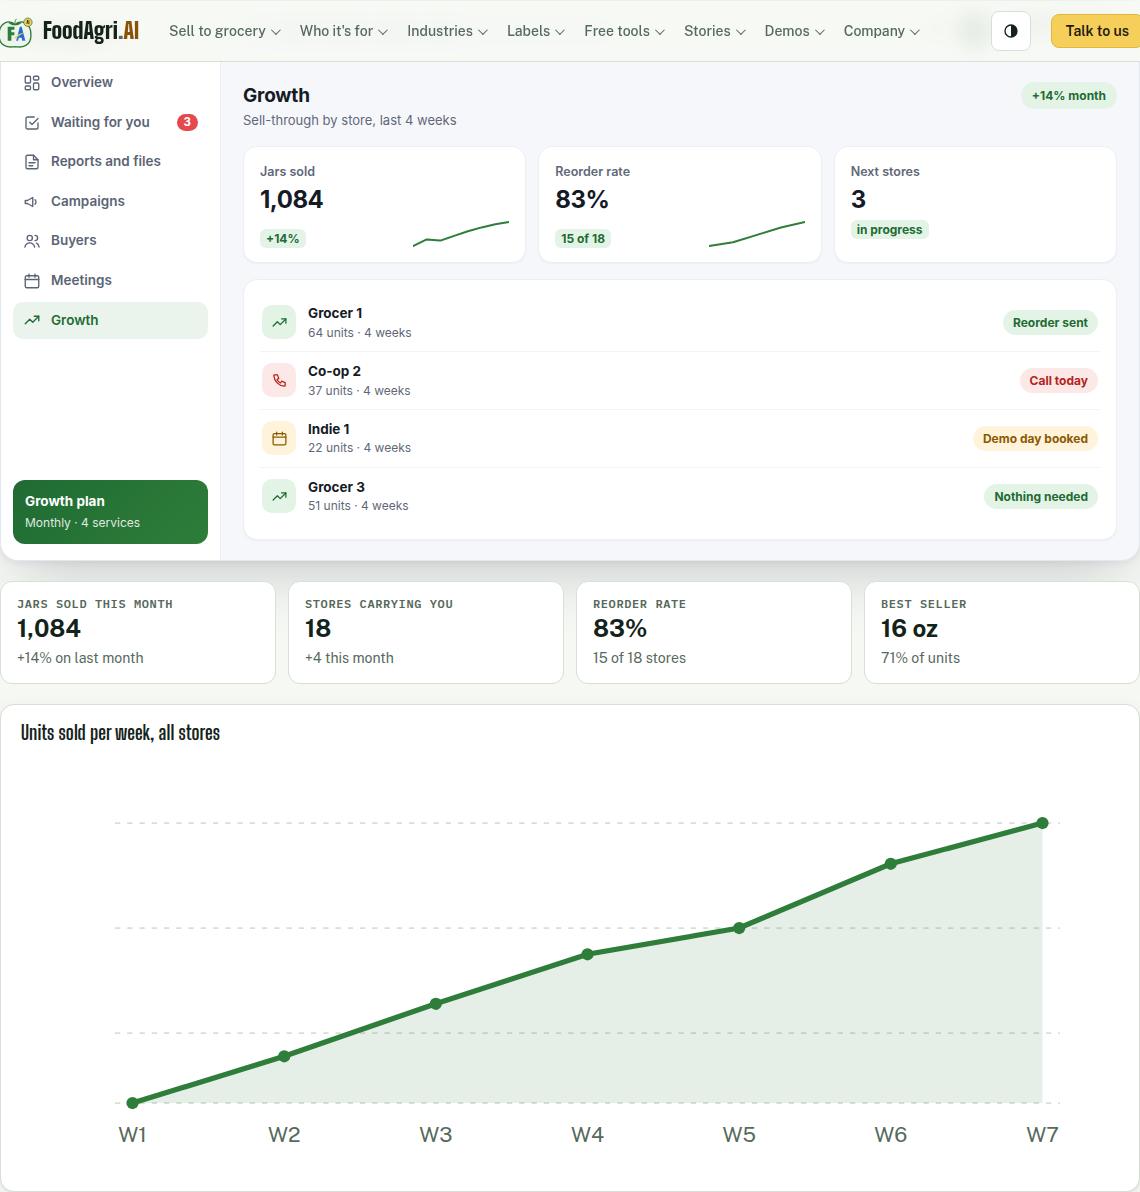
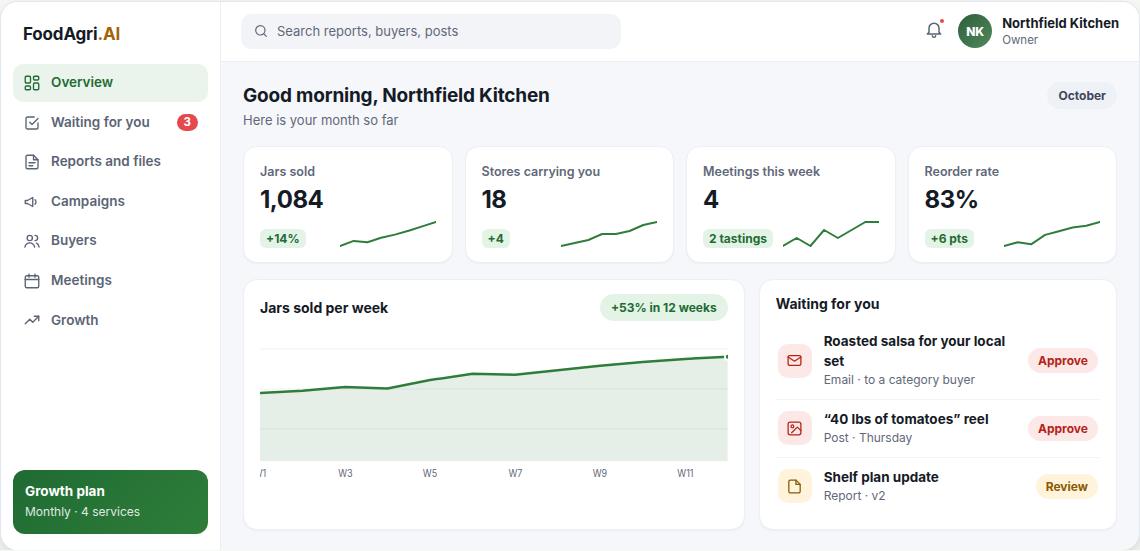
Real screens from our reports and dashboard, made for a made-up brand. Click any one to open the full sample.
What you would receive
Sample scenes built from fictional production data for North Valley QA team.
 Sample · fictional client
 Sample · fictional client
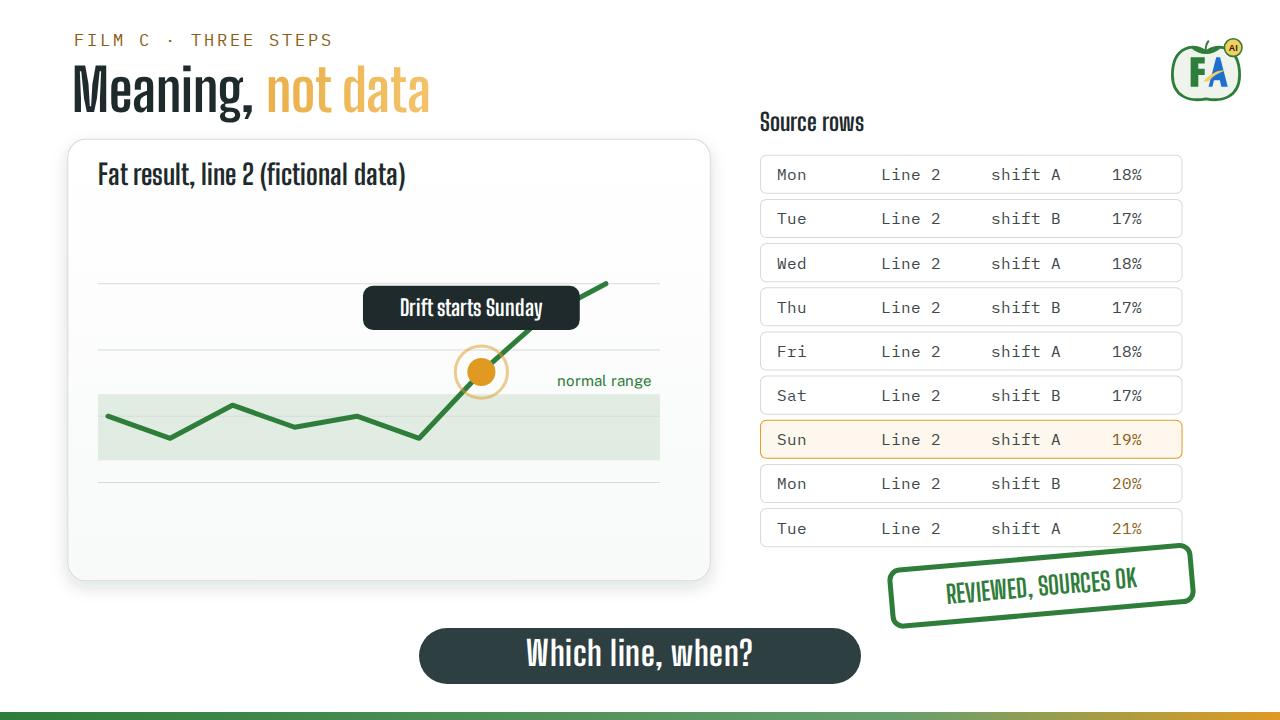
Step one: ask one business question, such as why fat results vary between shifts. Step two: pull an export from the systems the plant already uses, clean it, and check every value against its source rows. Step three: build a few clear charts, with a plain note on what changed, why it matters and what to check next.
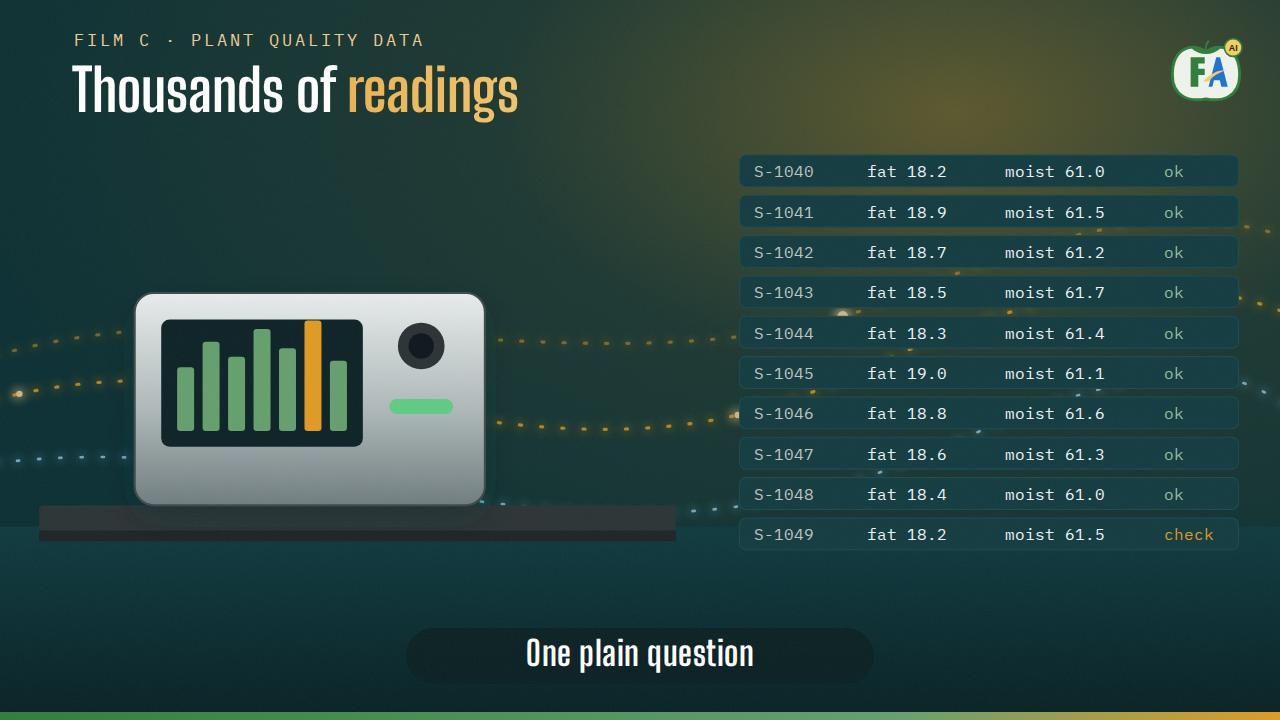
Full two-minute script in four chapters. Narration is recorded only after you approve the script.
All names, products and numbers in these samples are fictional. A real deliverable uses your data, its sources, and a reviewer sign-off.
In numbers
Move the sliders and click the charts. Every figure says where it comes from.
Pick a nutrient, then slide or click the chart
Federal labeling rule for Nutrition Facts (21 CFR 101.9). Sugar counts about 4 kcal per gram.
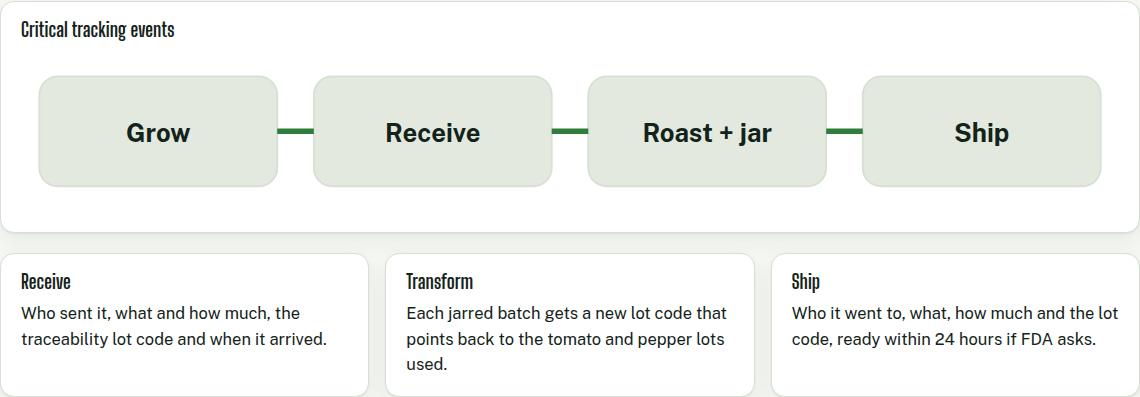
Two changes reach every food maker who sells to stores: traceability records for foods on the FDA list, and 2-D barcodes at the checkout.
Click a date to see what it means
Sources: the FDA traceability rule and its compliance-date notice, and the US 2-D barcode timeline. We explain each one in our guides, so you never have to read the rule itself.
Start small
Each step is useful on its own. You decide after each one whether to go further.
What data you have, who needs to see it, and what decision it should support.
One question, one dataset, a short chart pack.
Charts plus a plain-language story for leadership, management and quality, repeated each month or quarter.
Is this for you
How it works
Every engagement starts with a conversation. Scope and price come after it, in private.
A 30-minute call about what you make or sell, who you want to reach and what decision you need to make.
A short, fixed piece of research that answers one question with sources you can check.
We clean the export, check every value against its source rows, and build the charts and the story.
Approved work goes live. Every week you see what happened, in plain words.
Book a 30-minute call
We come to the call knowing what data it needs.
Questions
Exports from the systems you already use: lab software, spreadsheets, line reports. No new software to install.
Only your team and the people working on your project. It is never mixed with another customer.
Pricing is private. After a short call we send a written scope and price for your situation. There are no public packages or tiers.
No. We report what we did and what happened: research delivered, messages approved, replies, calls booked. We do not promise sales, placements or rankings.
Your files stay in your own workspace and are never used for another customer. Real customer data is only shared after a confidentiality agreement.
A 30-minute call tells you what you need next and what you would receive. The same four steps for every path, and you decide at the end of each one whether to go on.
You tell us what you make and what you need. No slides. We say plainly if we are not the right fit.
A short brief: who buys, what the rules say, where the price room is, and the sources behind each answer.
The pages, videos, reports and outreach drafts the plan needs, in your brand.
You approve every send and post. We report what worked and change what did not.